A sample 360-degree feedback: Overview charts
[This post is part of a series on Coaching Highlights from coaching Columbia Business School students. If you don’t see a Table of Contents to the left, click here to view the series, where you’ll get more value than reading just this post.]
Let’s look at part of a sample 360-degree feedback report. Today I’ll show the highlights — the summary of all the questions.
Even if you’ve never had a 360-feedback for yourself, just knowing how they work can help you. Understanding their structure alone can help you figure out how to improve your leadership skills.
First I’ll explain what you’re about to see. Each person responding to the survey about the person receiving the feedback gets asked to rate the person in several questions in several of the skills that contribute to leadership.
Leadership sub-skills
Why break the questions down into sub-skills? To rate them on “Leadership” alone is too vague. Nor does it help someone to tell them to “lead better.” You can rate them better on, say, “decision-making” and give them theory and exercises to improve their decision-making. Of course, all the sub-skills below are complex and you can break them down further too, depending on what level of depth you wanted to work on. For Columbia’s Core Leadership class, this is the level of detail the school chose.
Also, you can break leadership into different sub-skills than these. I’m sure other schools and rating systems choose different names, numbers of skills, and so on. As long as you break things down somehow, I think you’ll do okay.
Columbia’s sub-skills are:
- Decision making
- Perceiving others
- Motivating self and others
- Influencing others
- Managing conflict
- Working in teams
- Creativity
- Interpersonal dependency
The report describes what each sub-skill means. For our purposes, you’ll have to go with just the names.
Actually, the list of sub-skills reads almost like the syllabus of the class. After the 360-degree feedback, the class covers what each sub-skill means and gives theory and exercises for how to develop yourself in each area. The school also offers classes in most of these areas for those who want to go into more depth.
Personally, I like that process: give the students awareness of themselves in these areas from the report to ground them, then teach them what it means and how to improve themselves in each area. What leader wouldn’t want to go through that process?
Actually, many leadership coaches go through a similar process with their clients. Except most of us learn not to try to work on multiple areas at once with a client. Even two areas at a time confuses things too much. So most coaches I know, including myself, work with clients in one area at a time. But for a leadership class, I think covering all topics helps cover the field well.
The two overview charts
Here are two overview charts. They contain a lot of information and take a while to interpret, so we’ll break them down after.
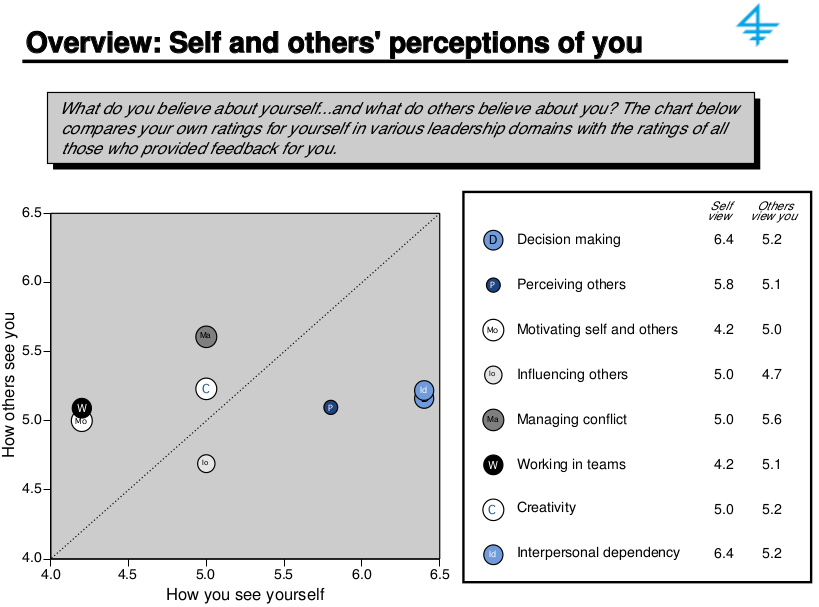
First is how others perceive you versus how you perceive yourself. 
The Structure of the Overview
I can’t tell you how much such a chart (and the one that follows) can help you understanding your strengths and weaknesses in leadership. If you haven’t received such a report and want to improve your leadership skills, I recommend finding a way to get one (like getting a coach who does them).
Interpreting them will take enough attention and give enough insight that I’ll write on that topic tomorrow. Today I’ll just describe the structure.
The position of each dot shows your performance in some area perceived by different people. This chart is useful for raising your self-awareness.
The letter in the dot shows the leadership sub-skill in question. Its horizontal position shows how you see your skill in that area. Its vertical position shows how others see you in that area. A point on the line says you see yourself how others do, which indicates high awareness, which has value even if your skill in that area isn’t that high.
Points high show others perceive you do well in that area. Points to the right show you think you do well in that area and probably have confidence. Points far below the line show you believe your skills are greater than others think. Points far below the line show others think your skills are higher than you do.
The table on the right shows the same information in tabular form.
Next is how people perceive you versus how they perceive your peers:
The Structure of the Overview
This chart shows how others see your skills (vertically) versus how they see others (horizontal). This chart is useful for comparing how you compare with others. Since leadership has no absolute or objective measure of ability, comparing yourself to others is one of the only ways to measure where your skills stand.
Tomorrow I’ll interpret each chart. Even if you’ve never had such a measurement for yourself, you can guess how you’d do in some areas. Also you can see what types of information you’d need to improve. If you’ve never had a review like this, you can see what paths people have found to raise self-awareness and improve.
Read my weekly newsletter

On initiative, leadership, the environment, and burpees
