
I talk about mental models and beliefs and how they determine how you live.
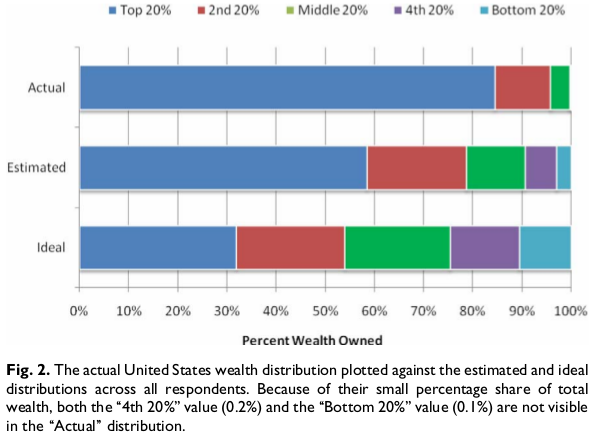
Two researchers (“Building a Better America−−One Wealth Quintile at a Time,” Michael I. Norton and Dan Ariely, Perspectives on Psychological Science 2011 6: 9) asked Americans about their views on how wealth is distributed among Americans. The chart below summarizes some results.
The top bar, “Actual,” shows the distribution of wealth owned by each fifth of the population—the richest to the poorest. The blue bar shows that the richest own most of it. The poorest forty percent own so little it doesn’t show on the graph. It makes me wonder what the distribution of wealth was in, say, France before their revolution.
The next set of bars, labeled “Estimated,” shows how people in each fifth think the wealth is distributed. Everyone’s ideas are pretty similar, especially compared to the Actual distribution.
The last set of bars, labeled “Ideal,” shows how people in each fifth think the wealth should be distributed. Again, everyone’s ideals are pretty similar and differ yet more from the Actual distribution.

In other words, we wish we lived in a world more equitable than we do yet live in one less equitable than we think we do. This double-misperception influences our lives, I suspect to sustain the misperception.
This version simplifies the above chart. We think we live in a world worse than we do, at least by what we want. Actually we live in a world far worse, at least if we consider farther from ideal worse. What are we doing to ourselves?
I am curious how these results would change (if at all) if the subject were “income” rather than “wealth.”
In the first part of the study, the researchers presented 3 distributions – the actual wealth distribution in the U.S., a completely equal distribution, and the actual _income_ distribution of Sweden – and asked which one they preferred as an ideal wealth distribution. The Swedish distribution was favored over the others.
There’s a _big_ difference between wealth and income when it comes to inequality though. If the distribution of income were perfectly equal, the distribution of wealth would still be unequal as some would choose to spend it all and others would save a portion.
My intuition tells me that most people don’t understand the difference, and that the results would be pretty much the same if they were asked about income – in other words, they would still choose the same ideal and estimated distributions, even though any given distribution of income would result in more inequality than the same distribution of wealth.
Are you aware of any follow-up studies that looked into income rather than wealth?
I didn’t put the graphs the first part that you mentioned partly for the questions you asked — why mention income at all in the paper? But the pie chart you mentioned didn’t seem to be labeled for the respondents anyway. The authors could have made up numbers for it to compare it with the other two distributions. In any case, they wrote this endnote about it: “We used Sweden’s income rather than wealth distribution because it provided a clearer contrast to the other two wealth distribution examples; although more equal than the United States’ wealth distribution, Sweden’s wealth distribution is still extremely top heavy.”
I don’t know of any follow-up studies.
You confuse wealth with income. Marxists have destroyed half the world with this.
I’m reporting other people’s results, so their terminology. In any case, I’m not sure the problem. Can you clarify?